 Lukla Data Studio
Docs Plans and performance
Statistics IO and TIME
Turn on SET STATISTICS IO, TIME for every run and read the reads per table and the CPU and elapsed time in a summary instead of a wall of messages.
On this page
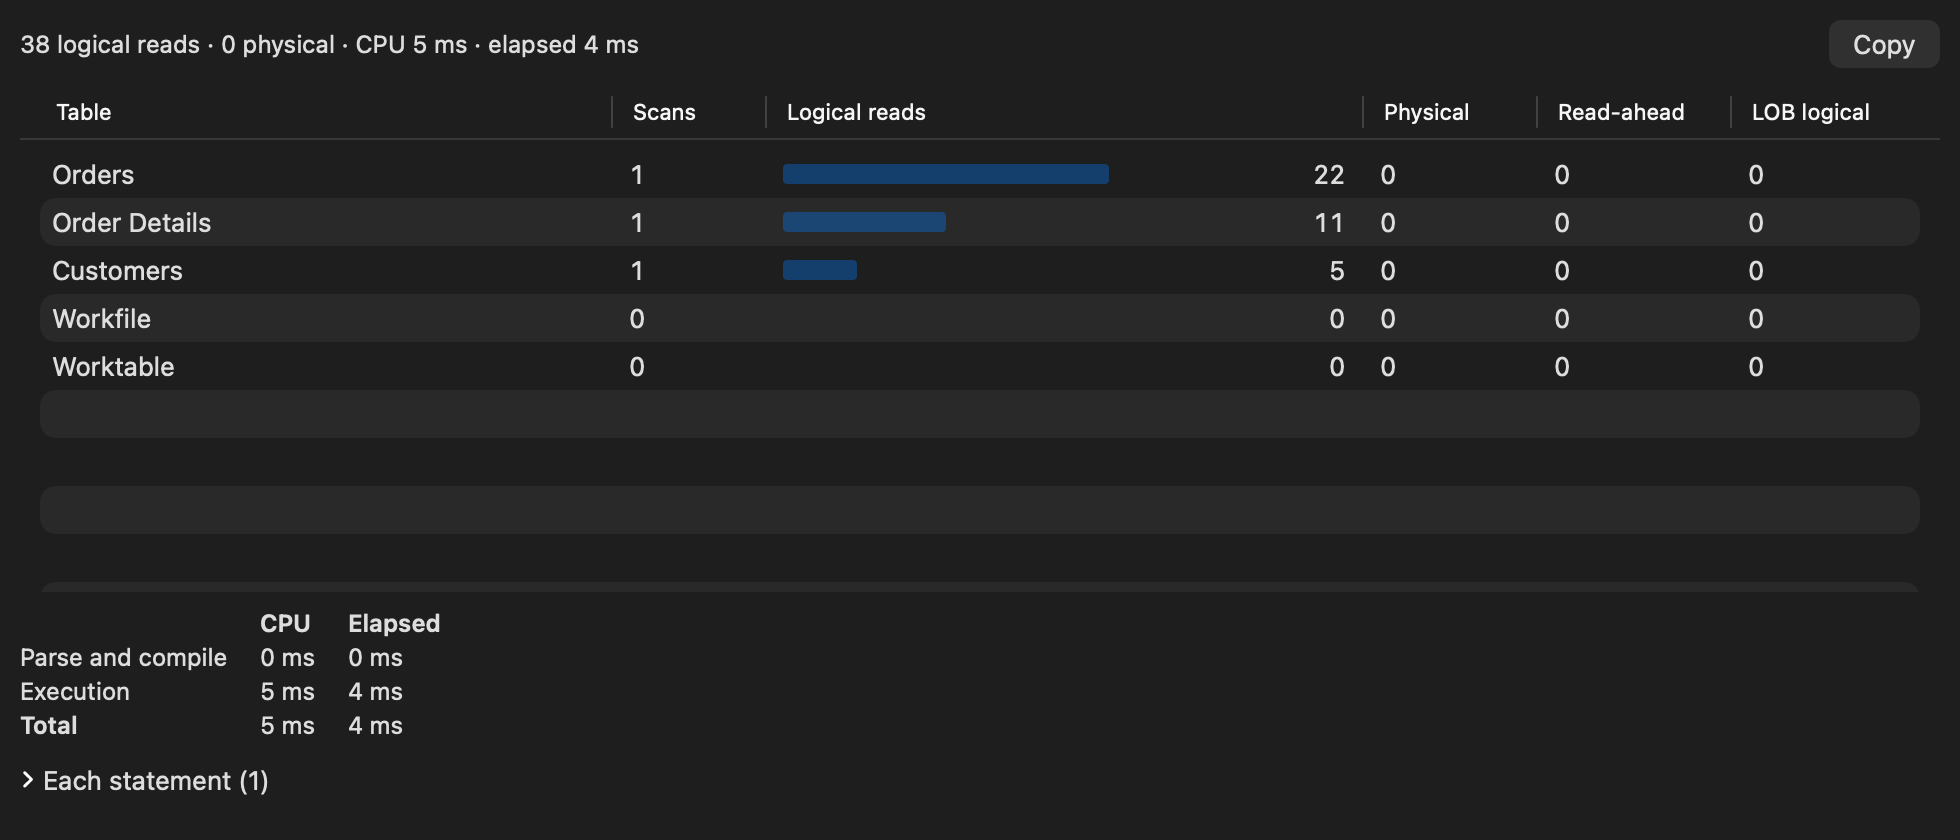
Include Statistics in the toolbar (⌥⌘I) wraps each run in SET STATISTICS IO, TIME ON, as SSMS users do by hand, and adds a Statistics tab next to the results.
#Reading it
- The headline sums the run: logical and physical reads, CPU and elapsed time.
- Reads per table, largest first, with a bar for logical reads. The table at the top is where to look first: an index that turns its scan into a seek usually cuts its reads the most.
- Times splits parse-and-compile from execution, so a slow compile (a huge query, or a plan that's never reused) stands out from a slow run.
- Each statement expands to the same numbers per statement for a multi-statement script.
Copy gives tab-separated text to paste into a ticket or a spreadsheet.
#A quick before-and-after
Run a query with statistics on, add an index, and run it again:
-- Before: a scan of every order
SELECT OrderID, OrderDate FROM dbo.Orders WHERE ShipCountry = N'Germany';

CREATE INDEX IX_Orders_ShipCountry ON dbo.Orders (ShipCountry) INCLUDE (OrderDate);

-- After: a seek, and far fewer logical reads on Orders
SELECT OrderID, OrderDate FROM dbo.Orders WHERE ShipCountry = N'Germany';
Turn on Include Actual Plan too to see why the numbers changed, and use Compare with Previous Run on the plan.
The setting is remembered, and applies to every tab.