 Lukla Data Studio
Docs Plans and performance
Execution plans
Estimated and actual plans as a diagram with plain-English steps, a sortable top-operators table, index suggestions, comparing with the previous run, and asking the AI to review a plan.
On this page
#Get a plan
- Display Estimated Plan (⌥⌘L) compiles the selection, or the whole script, and shows the plan without running anything.
- Include Actual Plan (⌥⌘M) is a toggle: while it's on, every run adds an Execution plan tab with the plan the server really used, including actual row counts and times.
Plans open in the Execution plan tab under the results. After a run with Include Actual Plan on, the rows come first, in Result; the plan is one click away in Execution plan. Save Plan… writes a .sqlplan file that SSMS opens too, and File ▸ Open Plan… opens .sqlplan files from SSMS or anyone else.
#The diagram
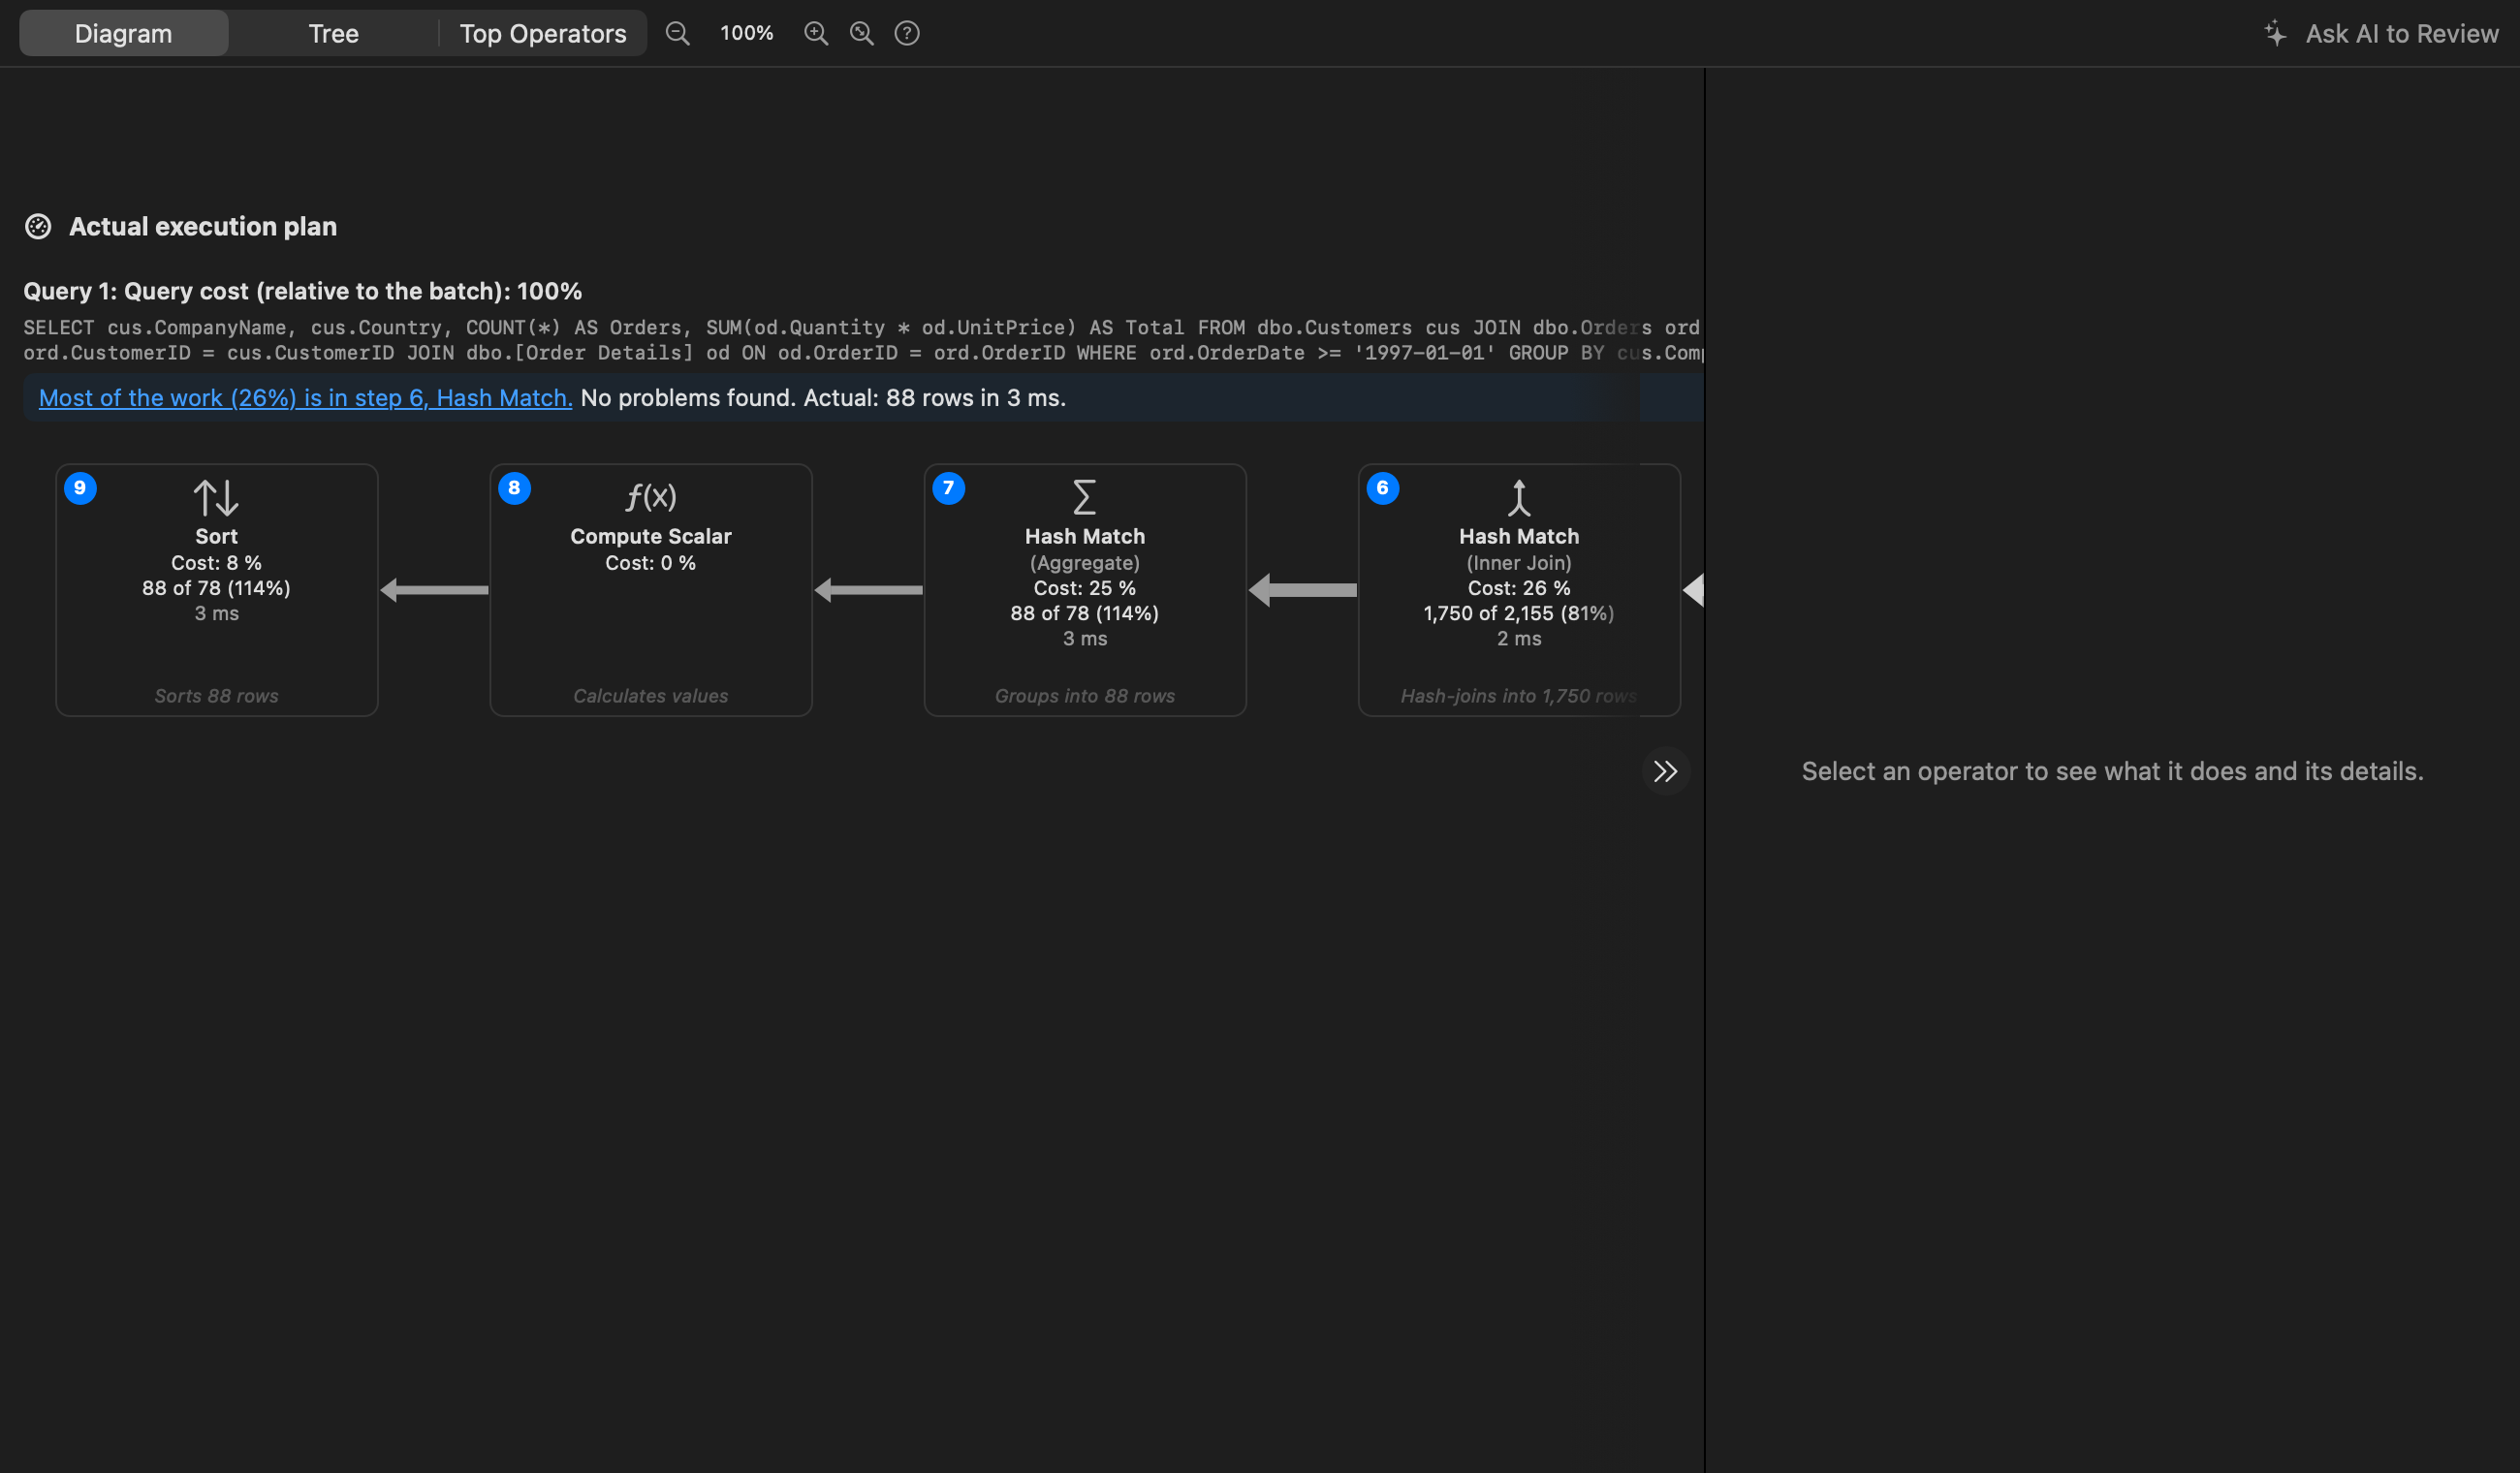
Read it right to left, as in SSMS: data flows from the operators on the right into the ones on their left. Each operator shows:
- a step number, so a sentence such as Most of the work (26%) is in step 6 points somewhere;
- its cost as a share of the statement;
- rows:
1,750 of 2,155 (81%)means 1,750 rows came out where 2,155 were estimated; - warnings (⚠) for problems such as implicit conversions or spills to tempdb.
Click an operator to see what it does, in plain English, and all its properties on the right. The summary above the diagram says where most of the work is and whether anything looks wrong. ? explains every icon, badge and arrow.
⌘+ and ⌘− zoom, ⌥⌘0 fits the plan to the window, and you can drag the canvas or scroll sideways.
#Top operators
Top Operators lists every operator in one sortable table: cost, estimated CPU and I/O, and estimated against actual rows. A row whose estimate is ten times off from reality is flagged, often a sign of stale statistics or parameter sniffing.
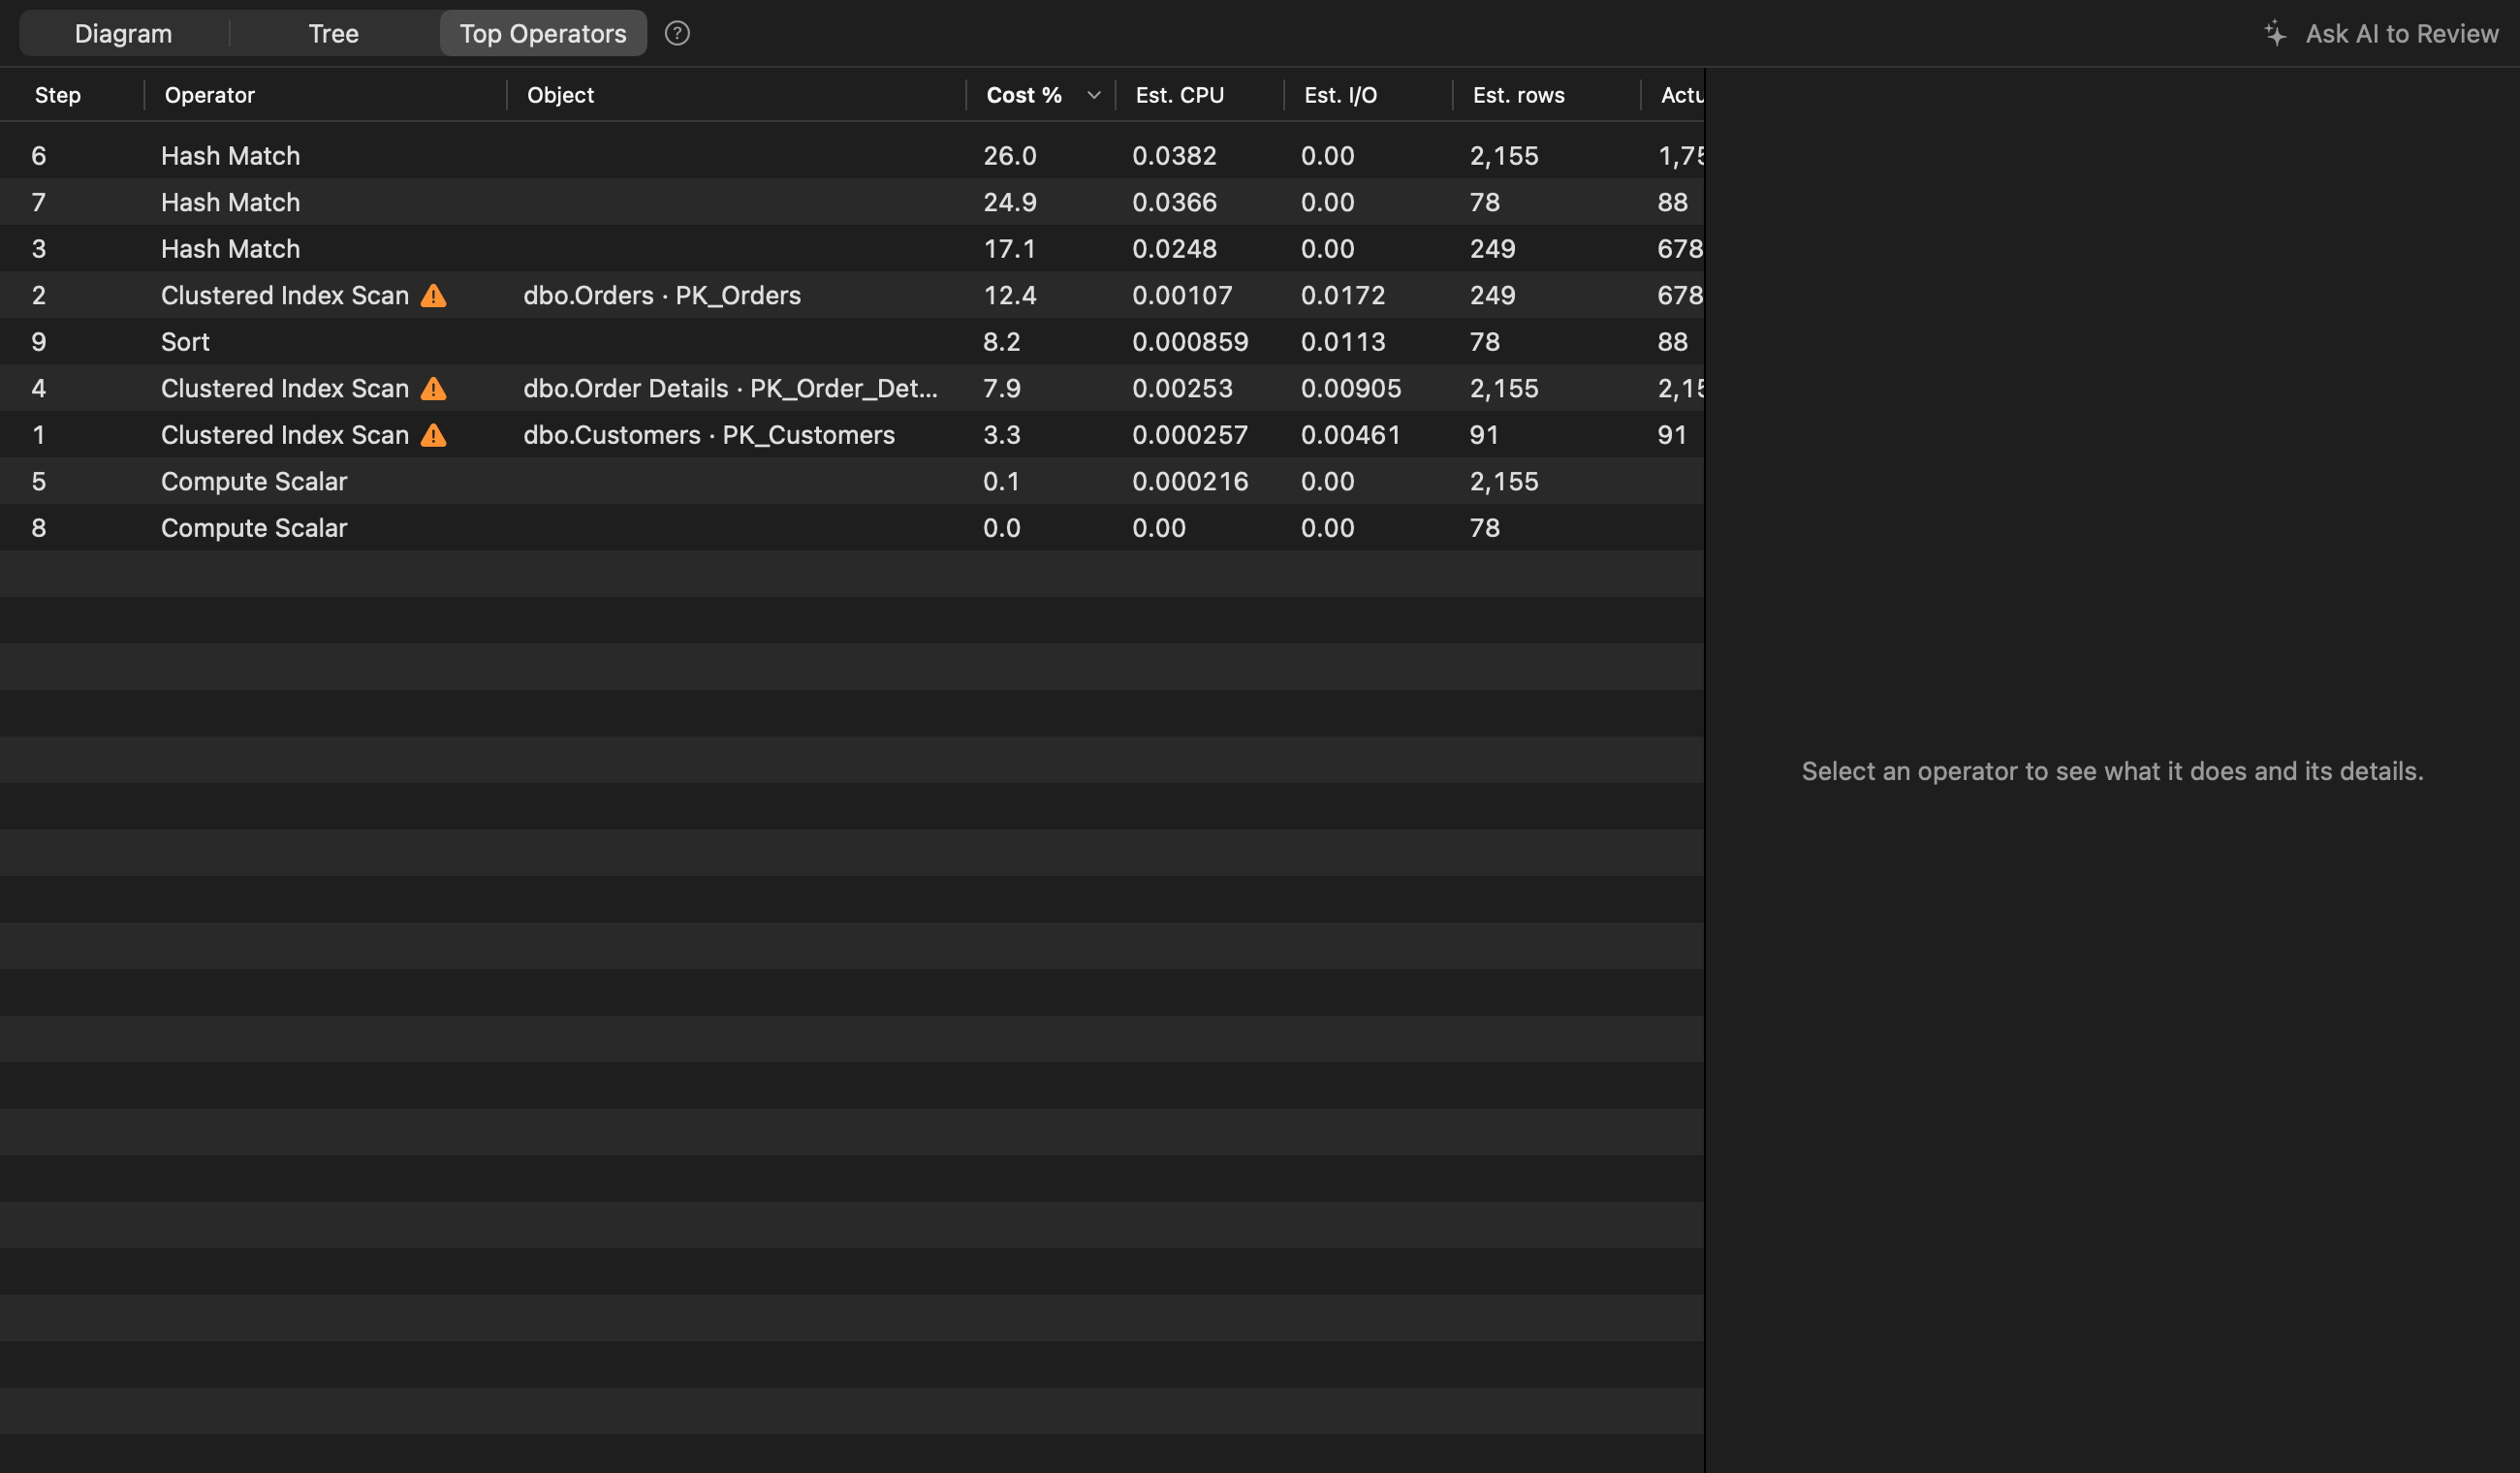
Tree shows the same plan as an indented outline, handy for very wide plans.
#Index suggestions
When the optimizer reports a missing index, the plan shows it with its estimated impact and a script for it:
USE [Northwind];
GO
-- Missing index suggested by the optimizer (estimated impact 81.4%). Review before running.
CREATE NONCLUSTERED INDEX [IX_Orders_OrderDate]
ON [dbo].[Orders] ([OrderDate])
INCLUDE ([CustomerID]);
Copy Script copies it and Open in New Tab opens it in a query tab; nothing runs until you run it. Treat it as a starting point: the optimizer suggests indexes one query at a time.
#Compare with the previous run
Change the query or add an index, run it again, and Compare with Previous Run shows what changed: estimated cost, elapsed time, rows and warnings, with the percentage change, and the operators that appeared, went or changed. For example, Clustered Index Scan → Index Seek on [dbo].[Orders].
#Ask AI to review a plan
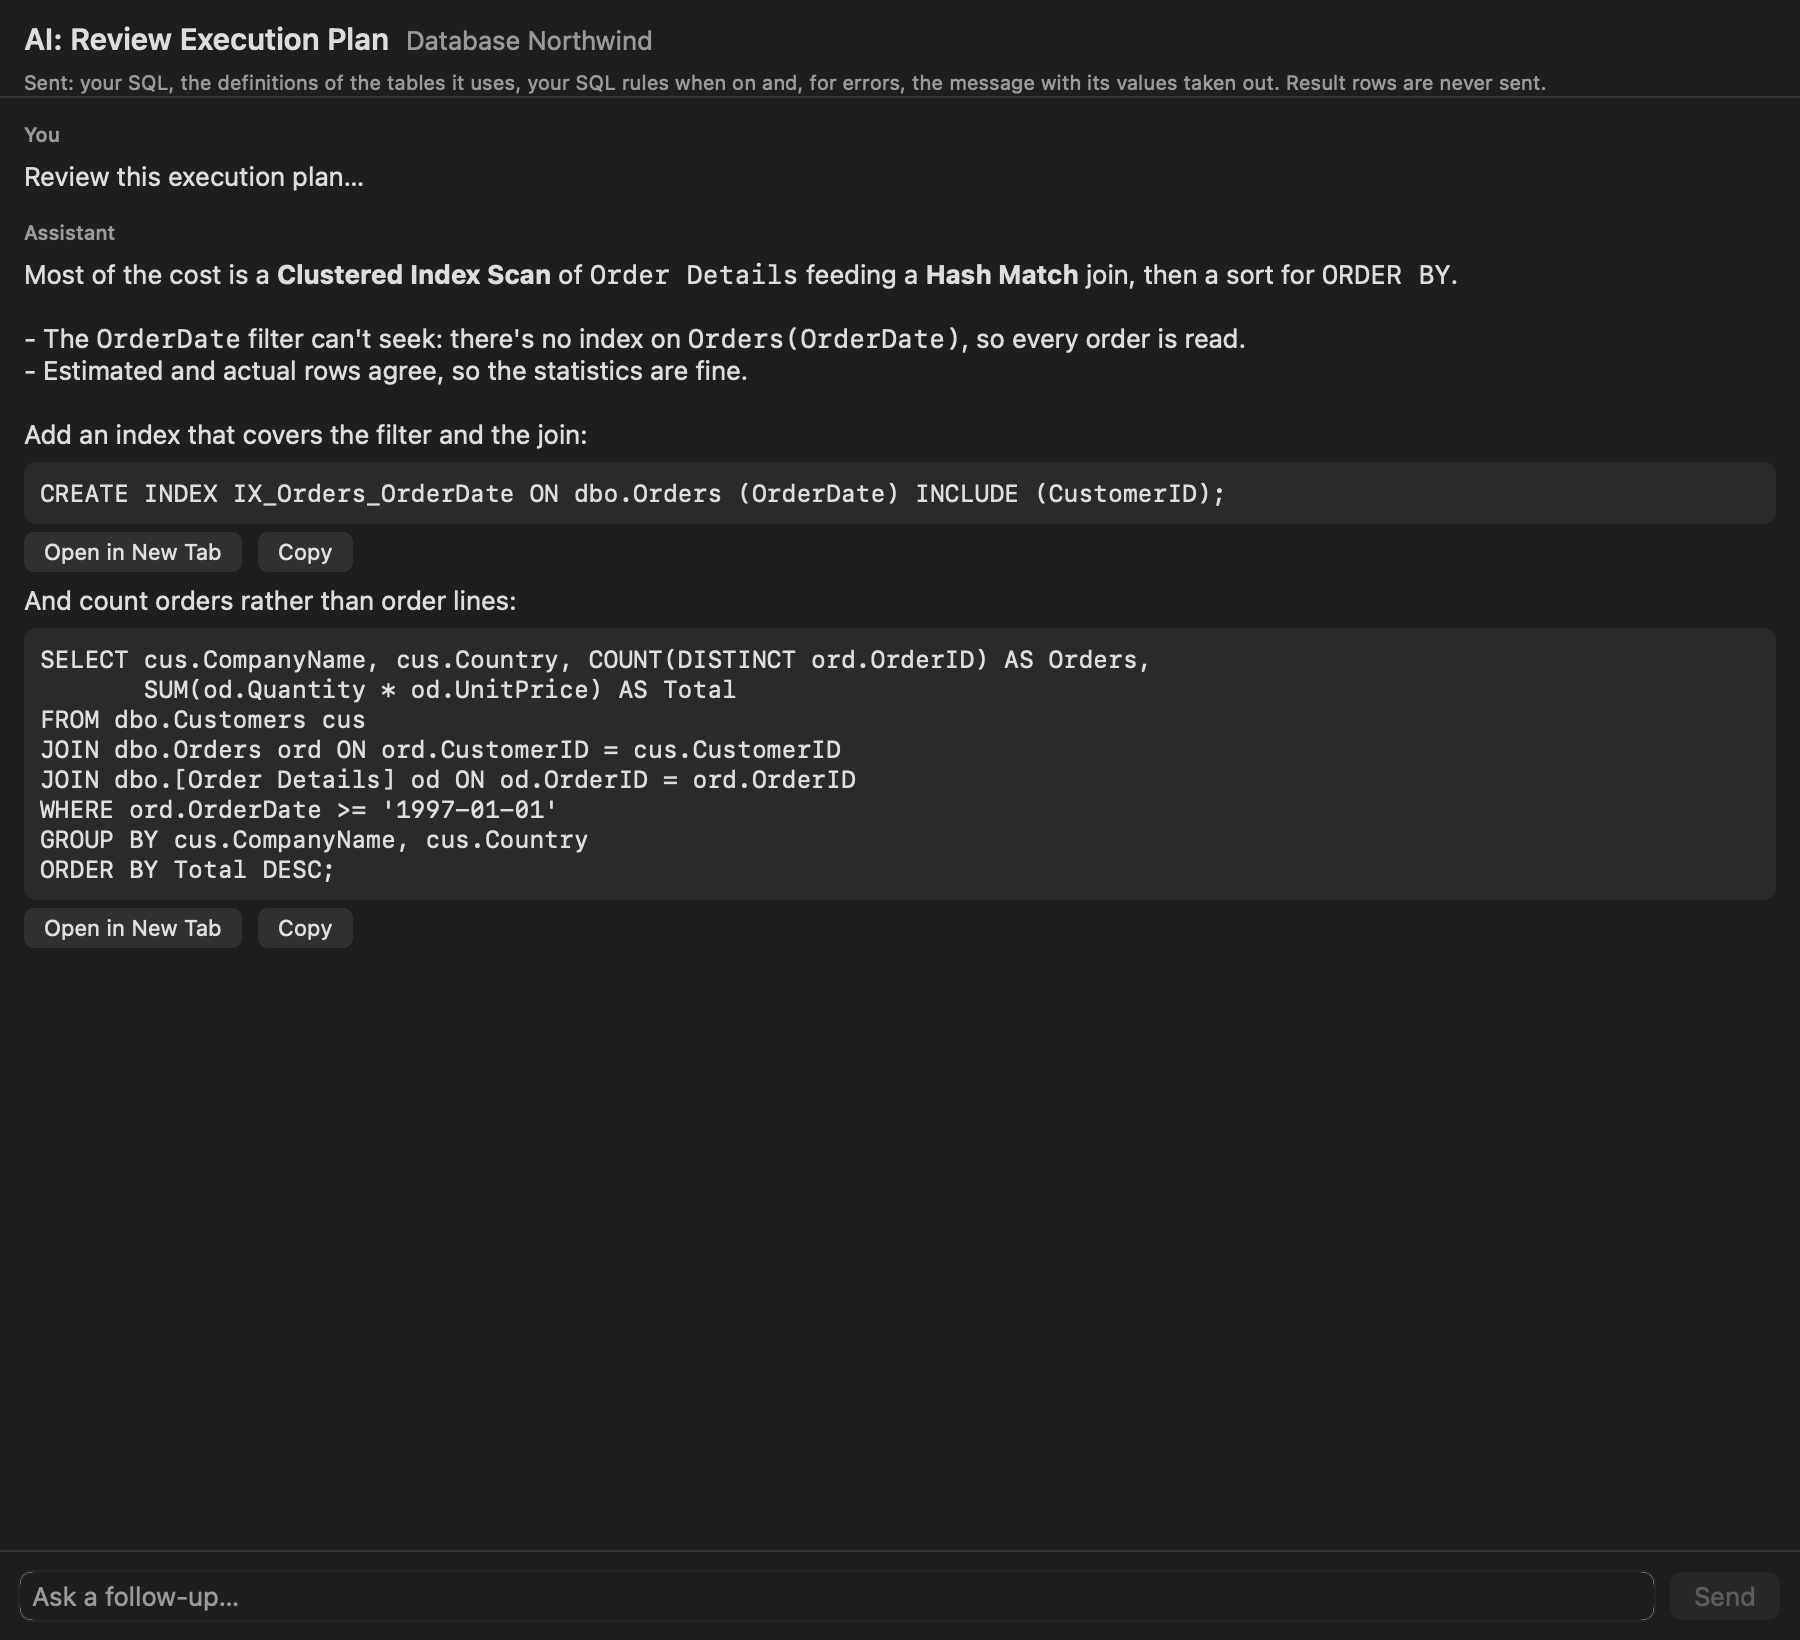
When the AI assistant is set up, Ask AI to Review on the plan sends the plan's statements, its costliest operators with estimated and actual rows, warnings, parallelism and missing indexes, and asks for the problems and their fixes.