 Lukla Data Studio
Docs Profiler
Profiler
Watch what applications send to SQL Server, live, with Extended Events: start from a question, hide the noise, group executions into queries, trace one tab, read deadlock graphs, and save or export traces.
On this page
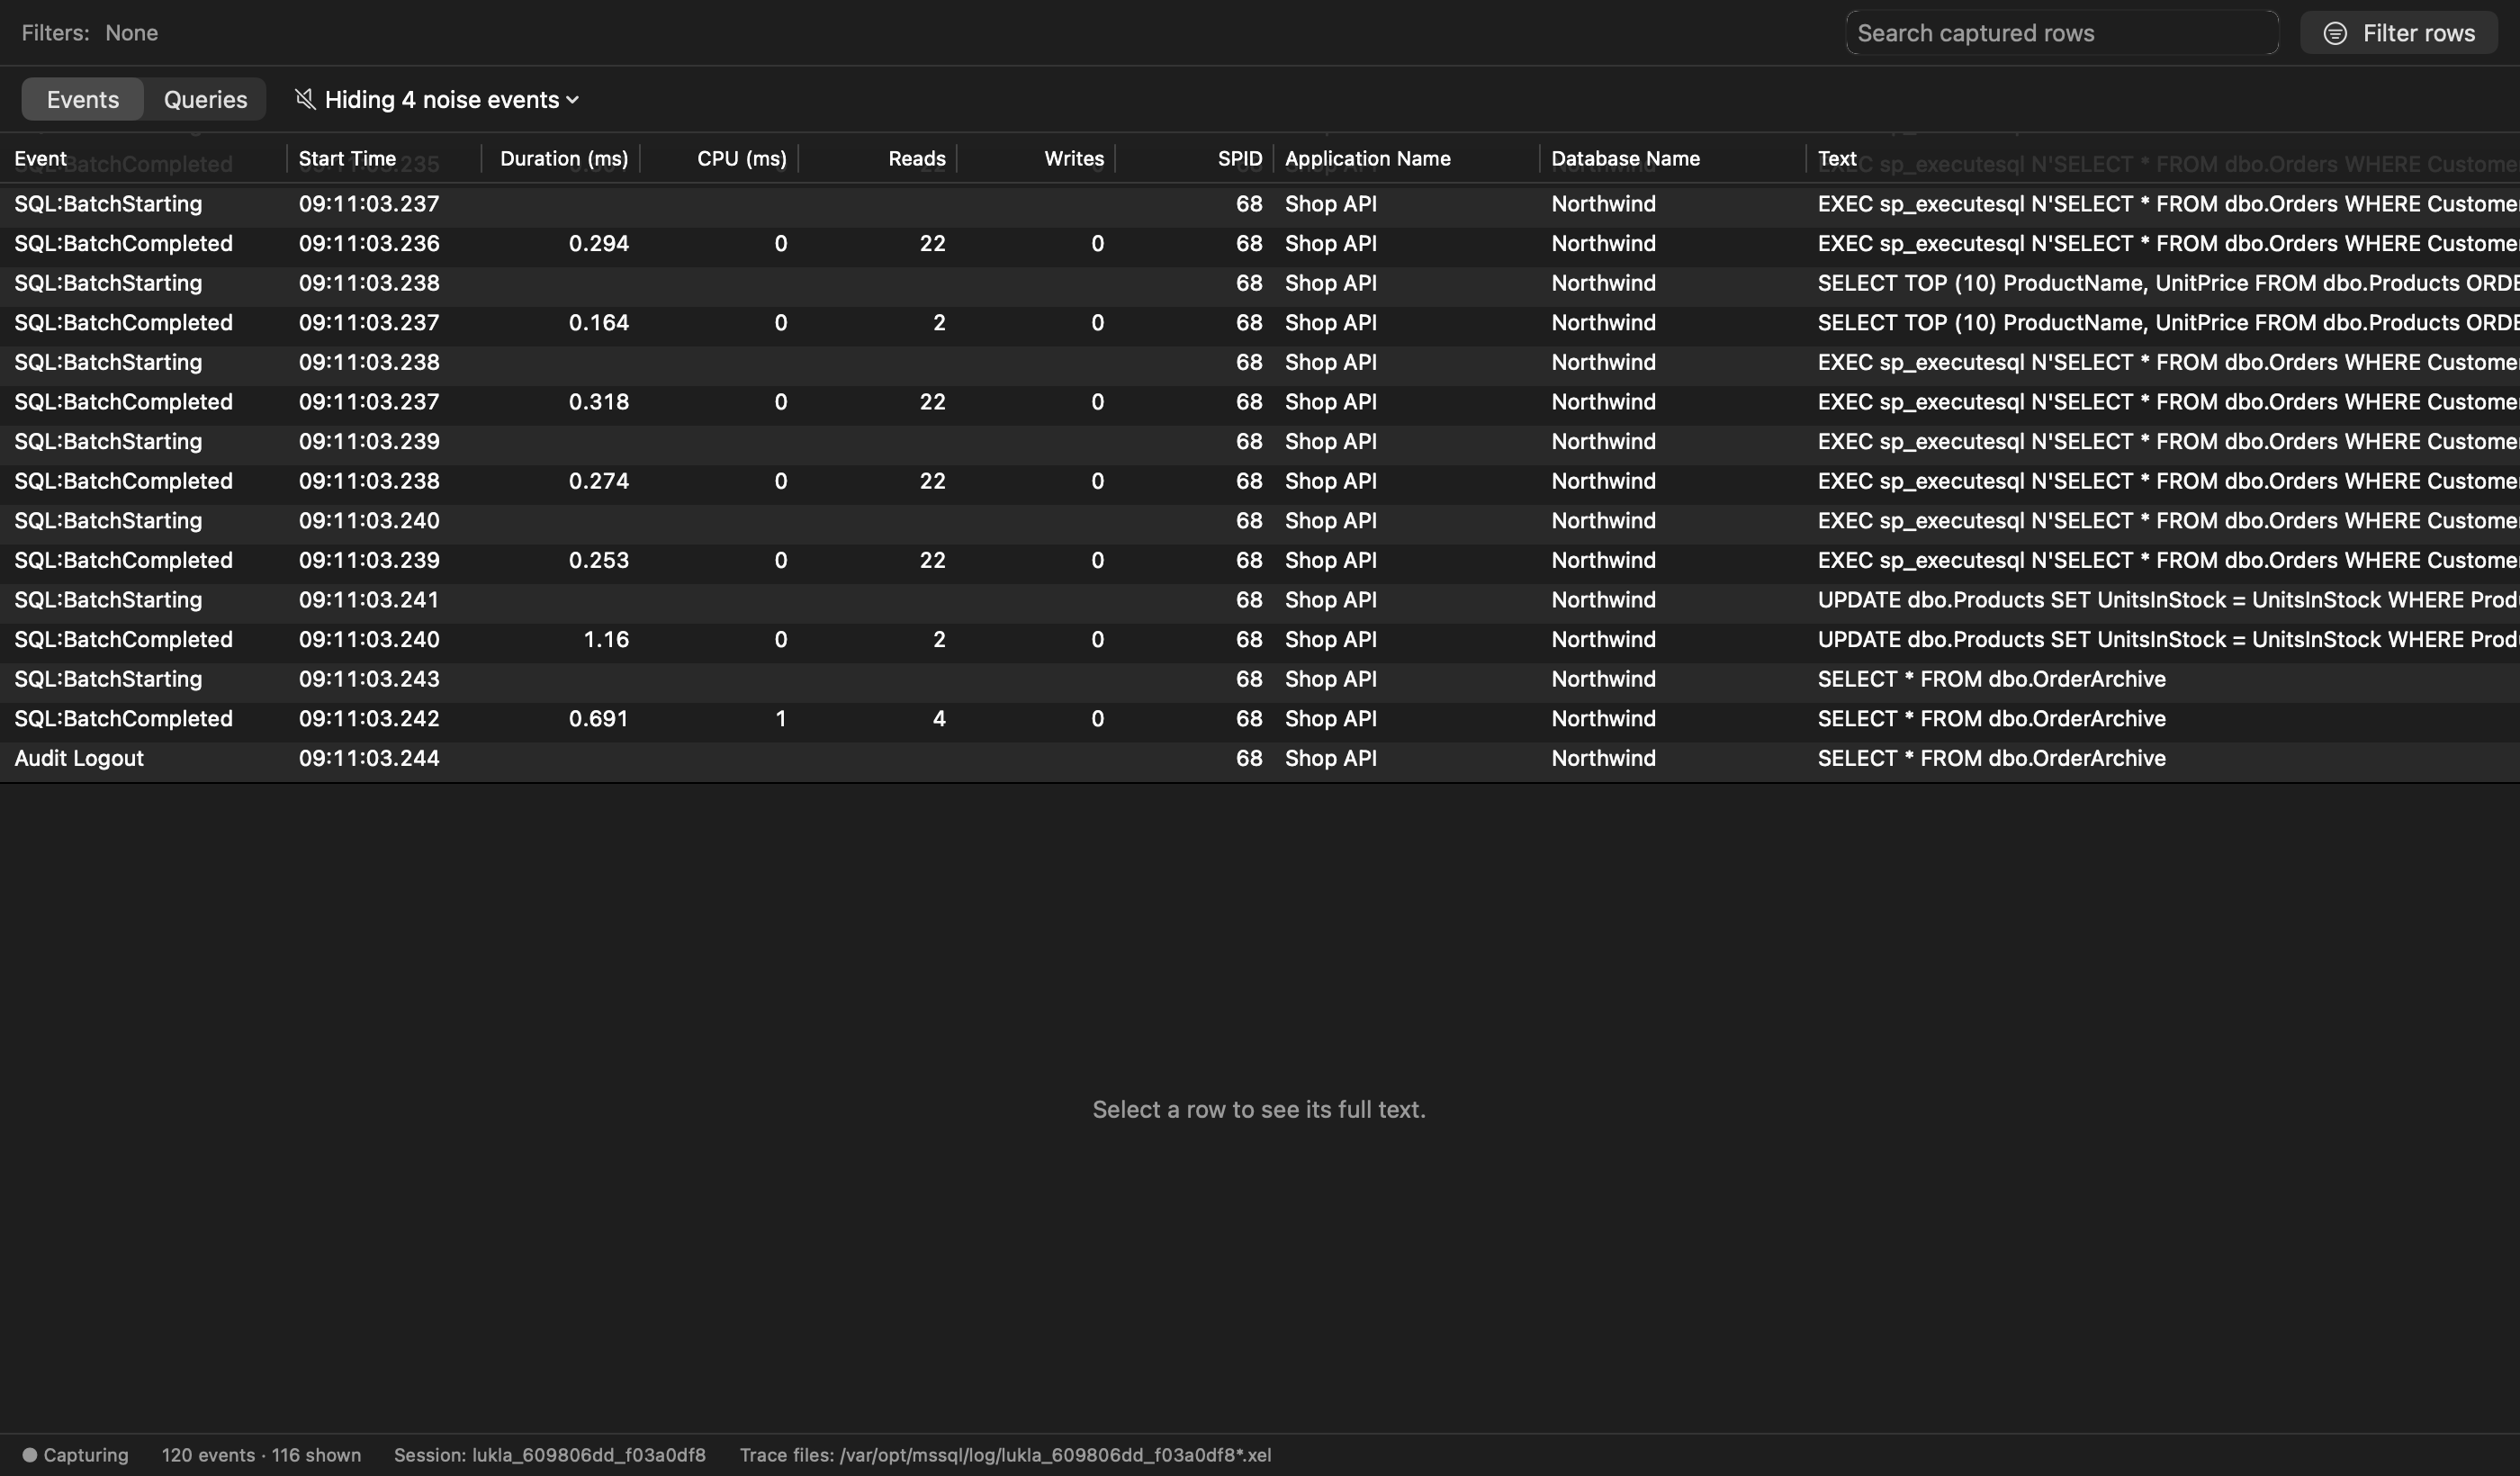
Lukla's profiler shows, live, every batch, procedure call, statement and error that clients send, much like SQL Server Profiler. It uses Extended Events, which replaced the deprecated SQL Trace, and it starts calm: the noise is counted and hidden, not dropped.
#Start a trace
Right-click a server in Object Explorer ▸ Start XEvent Profiler, or File ▸ New Profiler Trace… (⌥⌘P). Then start from a question:
| Goal | Captures |
|---|---|
| Slow queries | Statements and procedure calls that take at least the time you set, plus any errors. |
| Errors | Errors (severity 11 and up) and cancelled queries: what failed and the statement that failed. |
| Deadlocks | Each deadlock with its graph: who waited on whom, and which session was the victim. |
| Queries from this Mac | What your app or tests send from this computer, skipping everyone else's traffic. |
| One application | Only what one application sends (its connection string's Application Name). |
| One database | Only activity in one database. |
| Everything | Every completed batch and procedure call, errors and deadlocks: the classic trace. |
Every goal is a server-side filter, so filtered-out events never cross the network. Custom… opens the full Trace Properties sheet, laid out like Profiler's:
- Events, grouped as in Profiler (Stored Procedures, T-SQL, Errors and Warnings, Sessions, Locks);
- Columns the grid shows, and in what order;
- Filters on application, database, login, host and text (like / not like with
%), plus SPID, duration, CPU, reads, writes and row count.
Each connection remembers its last setup, and Save As… keeps a named one to load on any connection.
#Noise, hidden but never dropped
Connection-pool resets (sp_reset_connection), tool background queries (including SSMS's and SQL Agent's) session setup (SET options) and server housekeeping are recognised and hidden. Hiding N noise events ▾ shows how many of each and lets you show any kind again.
#Queries, not events
Queries groups thousands of executions by their shape, with literal values taken out, so WHERE CustomerID = 'ALFKI' and WHERE CustomerID = 'BERGS' are one query:
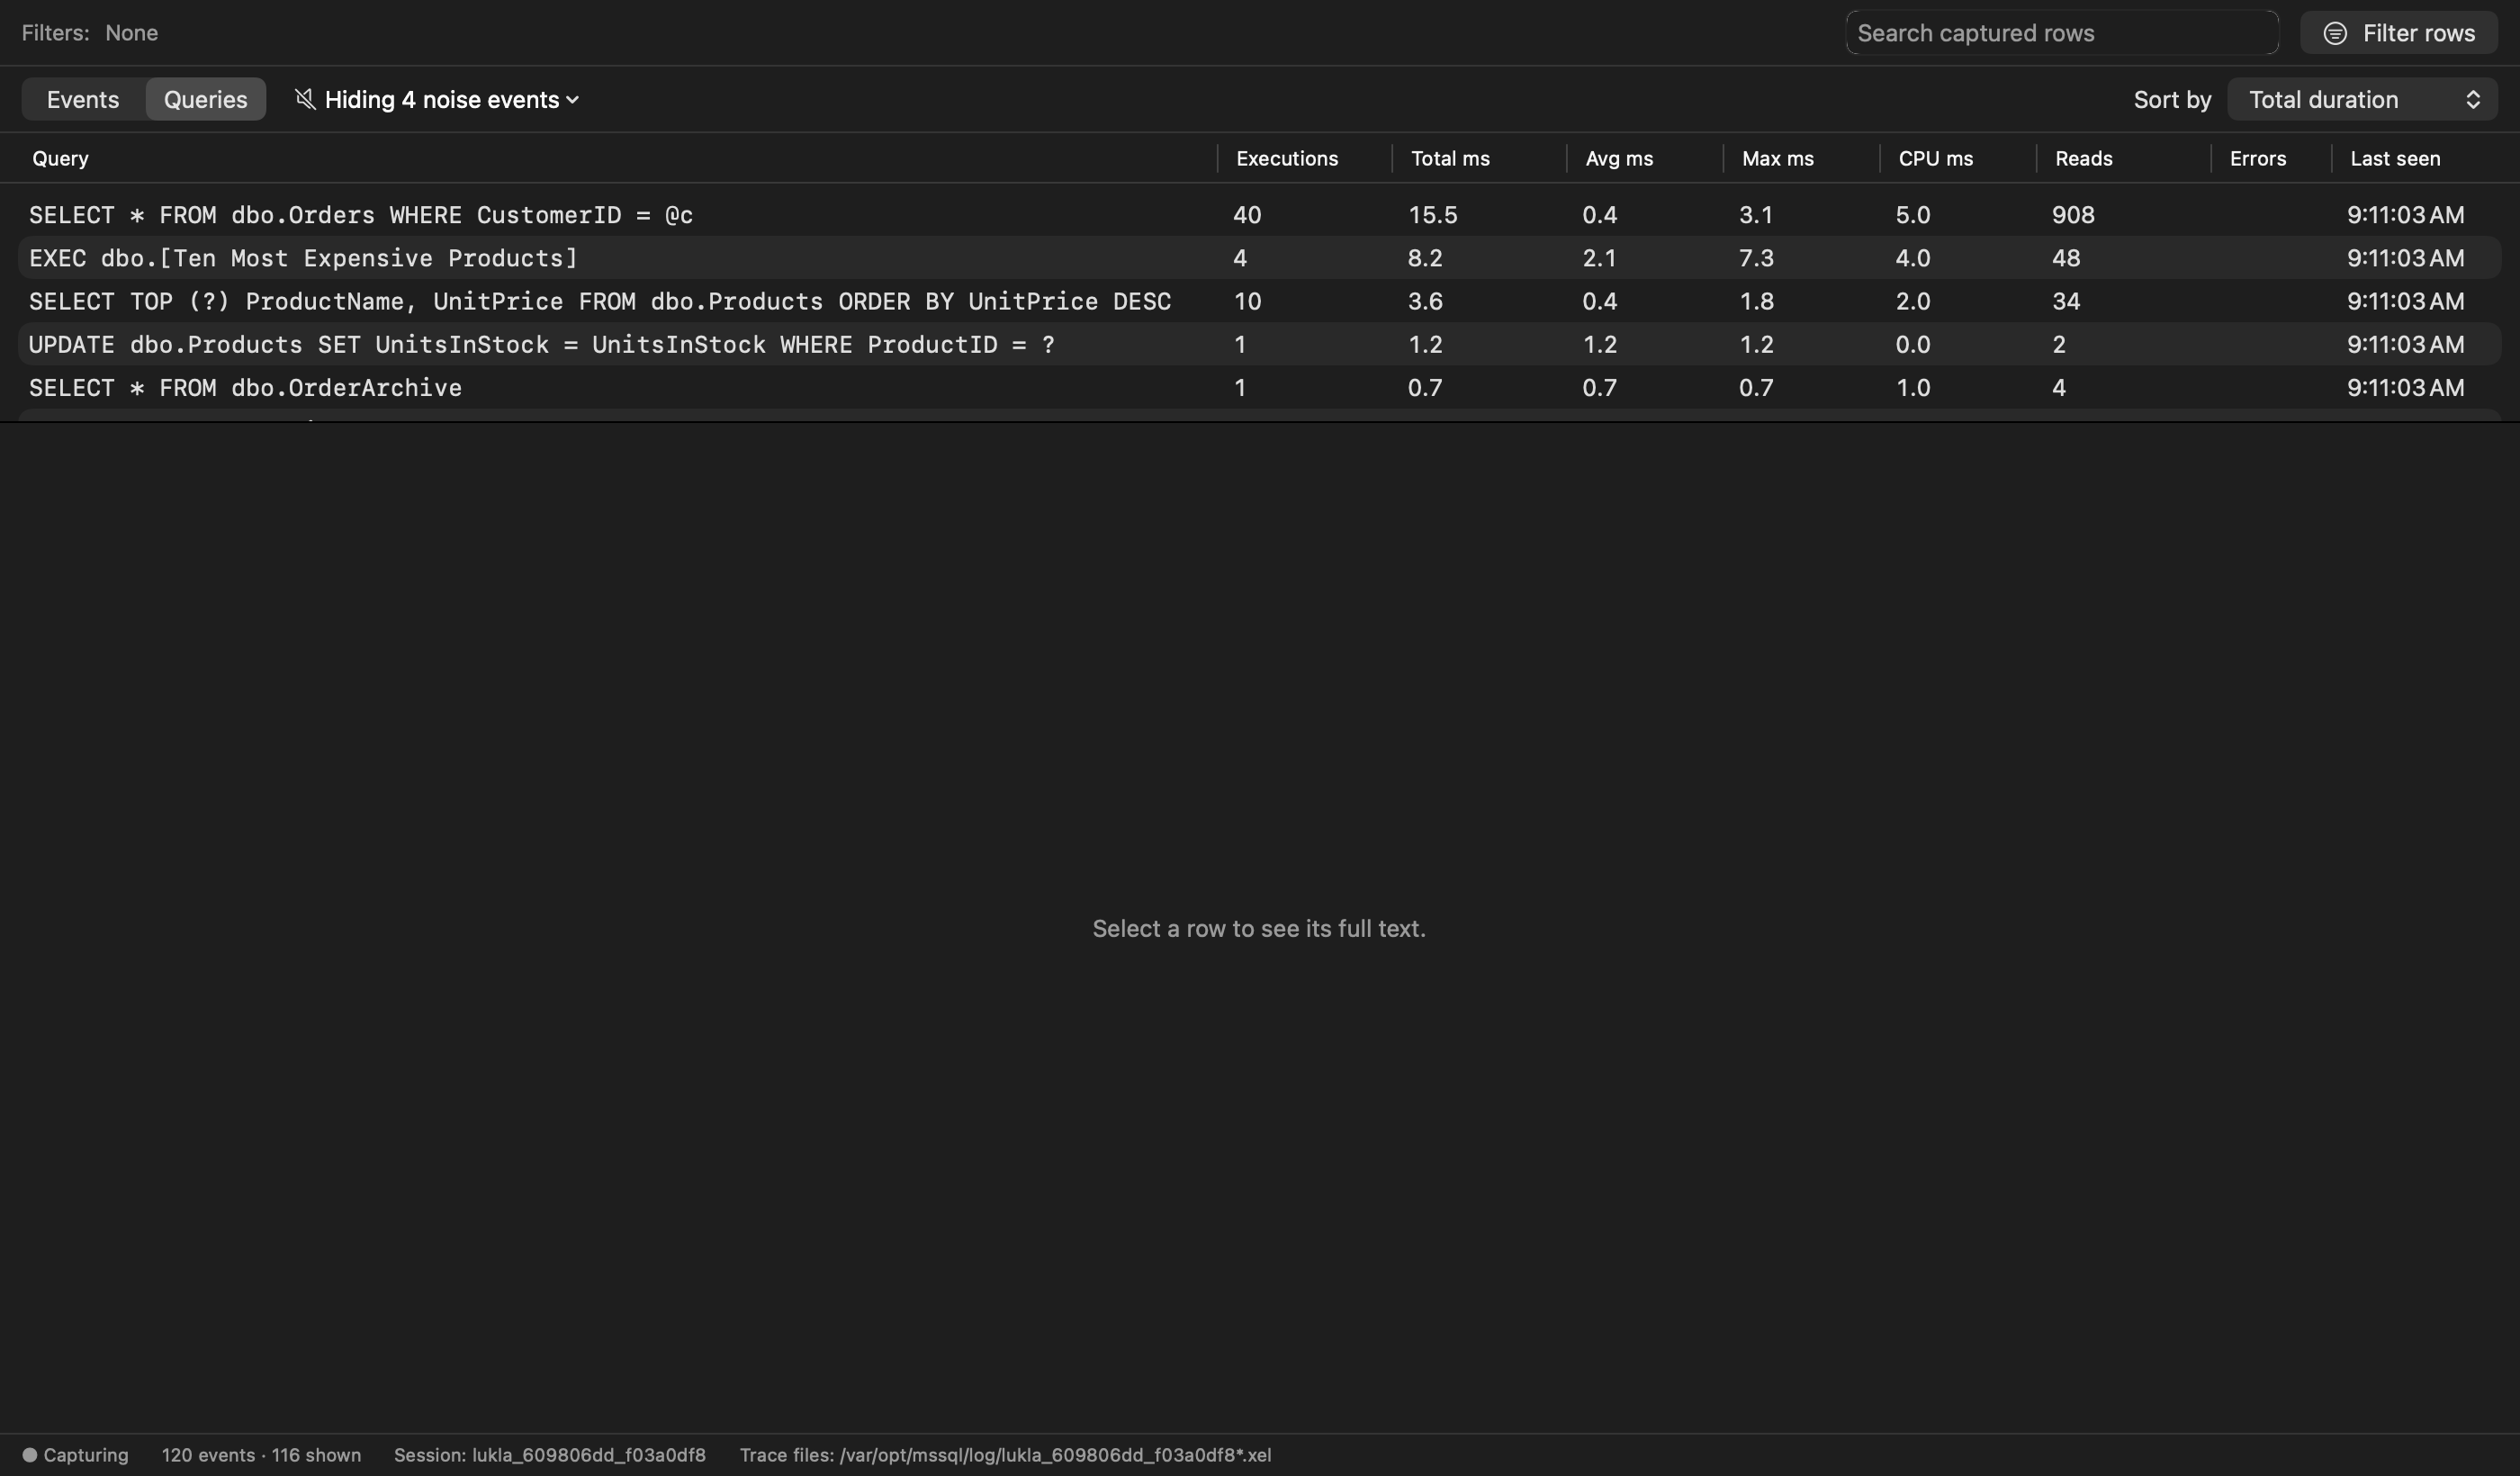
Sort by total duration, average, executions, CPU or reads, and double-click a query to see every execution of it.
#Find what you need
- The search box narrows the rows already captured (it doesn't change what's captured).
- Filter rows (⌥⌘F) adds
column / operator / valueconditions on the captured rows, each one switchable without deleting it. - Highlight rules in Settings ▸ Highlighting colour rows by condition: by default, duration of 1 s or more red and 10,000 reads or more orange.
- Select a row to see its full text; Open in Editor opens the query in a tab. An
sp_executesqlcall becomes runnable SQL:
-- exec sp_executesql N'SELECT * FROM dbo.Orders WHERE CustomerID = @c', N'@c nchar(5)', @c = N'ALFKI'
-- opens as:
DECLARE @c nchar(5) = N'ALFKI';
SELECT * FROM dbo.Orders WHERE CustomerID = @c;#Trace this tab
Query ▸ Trace This Tab traces only the current query tab's session, statement by statement: a quick way to see what a procedure really runs.
#Deadlock graphs
Traces capture Deadlock graph events (Events ▸ Locks). Select one to see the graph: processes as ovals (the victim crossed out in red), locks as rectangles, and arrows for who holds and who waits. Hover a process to see its query; Graph | XML shows the raw report.
#Save, open and export
- Save (⌘S) writes a
.luklatracefile with every captured row and the setup, compressed. Open it later with File ▸ Open…, or double-click it in Finder. - Export Rows writes the rows shown (search and filters applied), with the visible columns in grid order, as CSV (Excel-friendly, formula-safe) or JSON.
- File ▸ Open Server Trace File… reads a
.xelfile on a connected server: pick one from the server's log folder or type a path such asD:\traces\app*.xel. (The.xelformat has no public spec, so SQL Server itself reads it.)
#Permissions and what a trace leaves behind
The login needs ALTER ANY EVENT SESSION and VIEW SERVER STATE (on SQL Server 2022, CREATE ANY EVENT SESSION with DROP ANY EVENT SESSION, and VIEW SERVER PERFORMANCE STATE, also work).
Each trace creates an Extended Events session named lukla_<install id>_<random> and drops it when the trace stops, the window closes, or the app quits. If the app crashes, the next connection from this Mac offers to remove its leftover sessions; other people's sessions are never touched. Each trace also writes up to 5 × 10 MB .xel files into the server's log folder, which a DBA can remove; the status bar shows where.