 Lukla Data Studio
Docs Server and objects
Activity Monitor and Analyze Server
What's running on a server right now, who is blocking whom, waits, file I/O and expensive queries; and a one-click review of configuration and the plan cache.
#Activity Monitor
Window ▸ Activity Monitor (⌥⌘A), or right-click a server ▸ Activity Monitor, opens a live view of the server, as in SSMS.
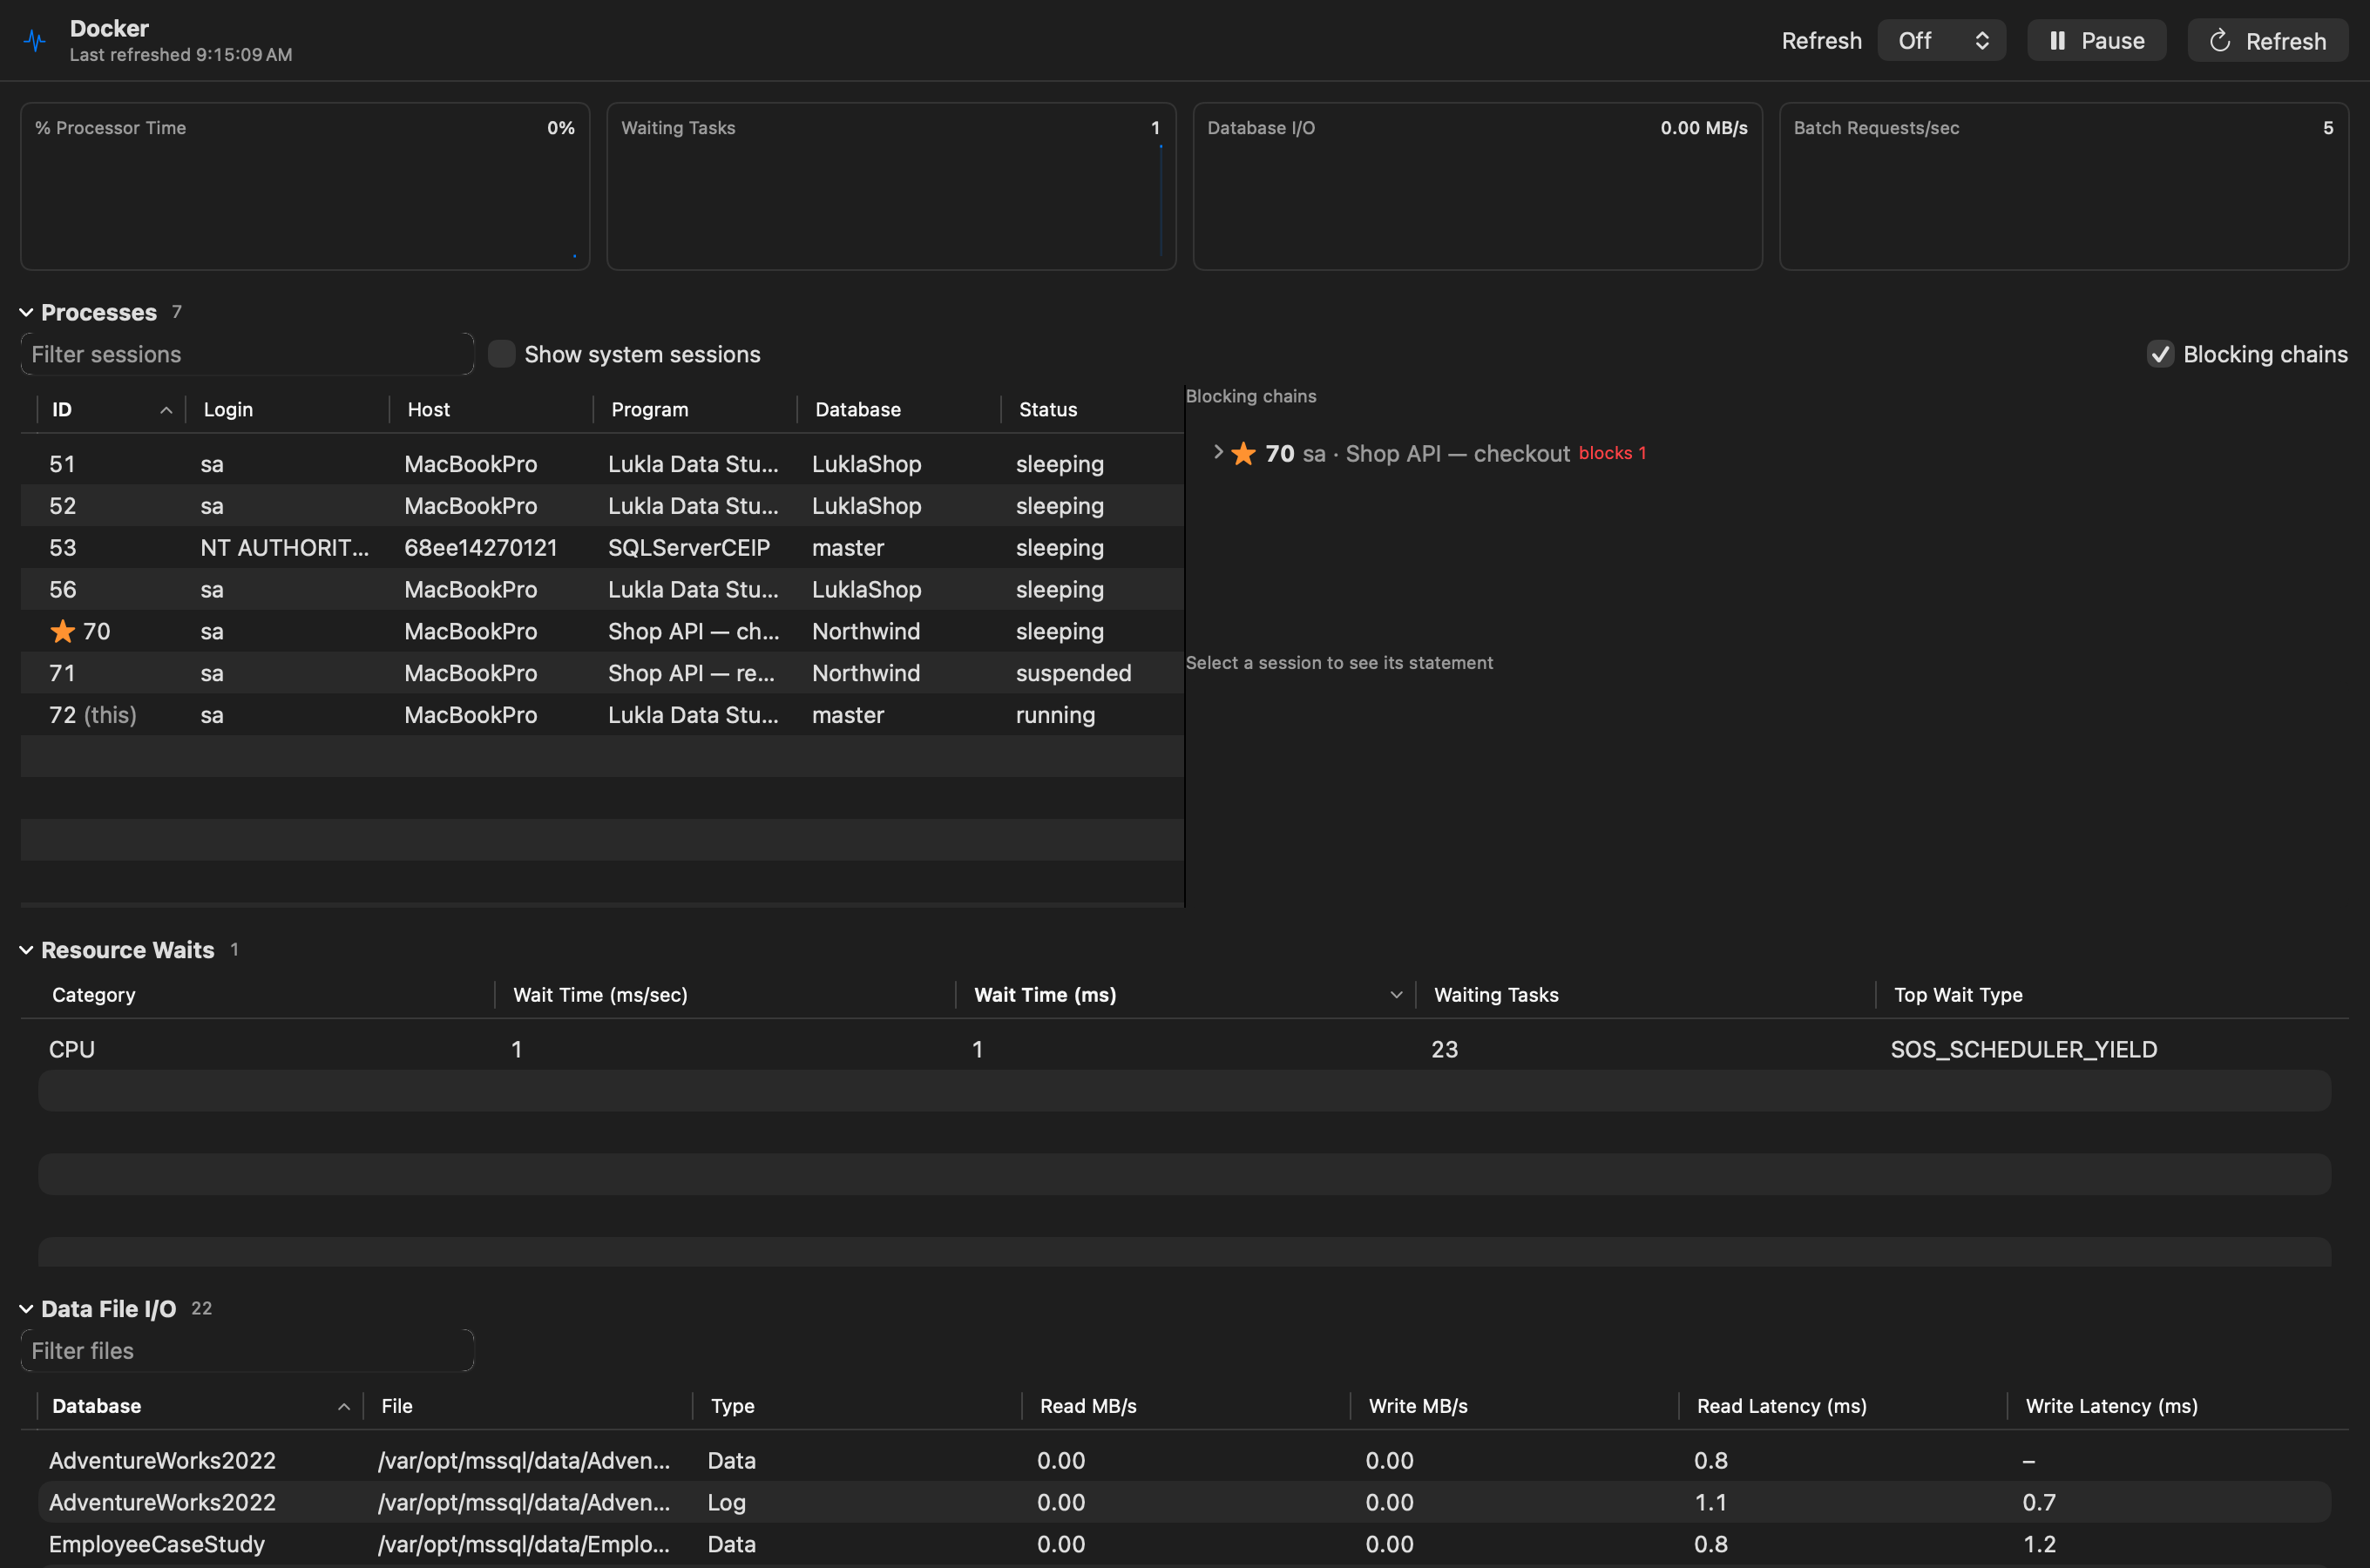
- Overview: % processor time, waiting tasks, database I/O and batch requests per second, as sparklines.
- Processes: every user session with its login, host, program, database and status. Show system sessions adds the server's own; your own session is marked (this).
- Blocking chains: who blocks whom, with the head of each chain starred and how many sessions it blocks. Select a session to see its current statement.
- Resource Waits: what sessions are waiting for, by category, with the top wait type.
- Data File I/O: reads, writes and latency per database file.
- Recent Expensive Queries and Active Expensive Queries, from the plan cache and the requests running now.
Refresh sets how often it updates (or off), and Pause holds it while you read.
#Acting on a session or query
Right-click a session for Show Plan (the plan it's running), Copy Statement, Copy Row and Kill Session… (which asks first). Expensive queries have Show Plan, Analyze, Open in Query Tab and Copy Query.
To try a blocking chain yourself, run these in two query tabs:
-- Tab 1: hold a lock
BEGIN TRAN;
UPDATE dbo.Products SET UnitsInStock = UnitsInStock + 1 WHERE ProductID = 11;
-- (leave the transaction open, then ROLLBACK when you're done)

-- Tab 2: wait for it
SELECT * FROM dbo.Products WHERE ProductID = 11;#Analyze Server
Right-click a server ▸ Analyze Server… runs a one-off review on its own connection and opens a report tab with a card per finding, ranked by severity:
- Plan cache: missing indexes, implicit conversions, spills to tempdb, key lookups, plan warnings, and a cache full of single-use plans.
- Configuration: MAXDOP, cost threshold for parallelism, max server memory, optimize for ad hoc workloads, auto-shrink and auto-close, page verify, backups, log size, DBCC CHECKDB, tempdb files and compatibility level.
Each finding explains why it matters, what to change, and where there's a fix, a script to copy (nothing runs by itself).
#Permissions
Both need VIEW SERVER STATE (or VIEW SERVER PERFORMANCE STATE on SQL Server 2022). Without it, the sections that need it say so.