 Lukla Data Studio
Docs Results
Analyzing results
Data bars, Transpose and Group By on a result set, and the summary of the selected cells, without writing another query.
The Analyze ▾ menu above the grid works on the result you already have, with no new query.
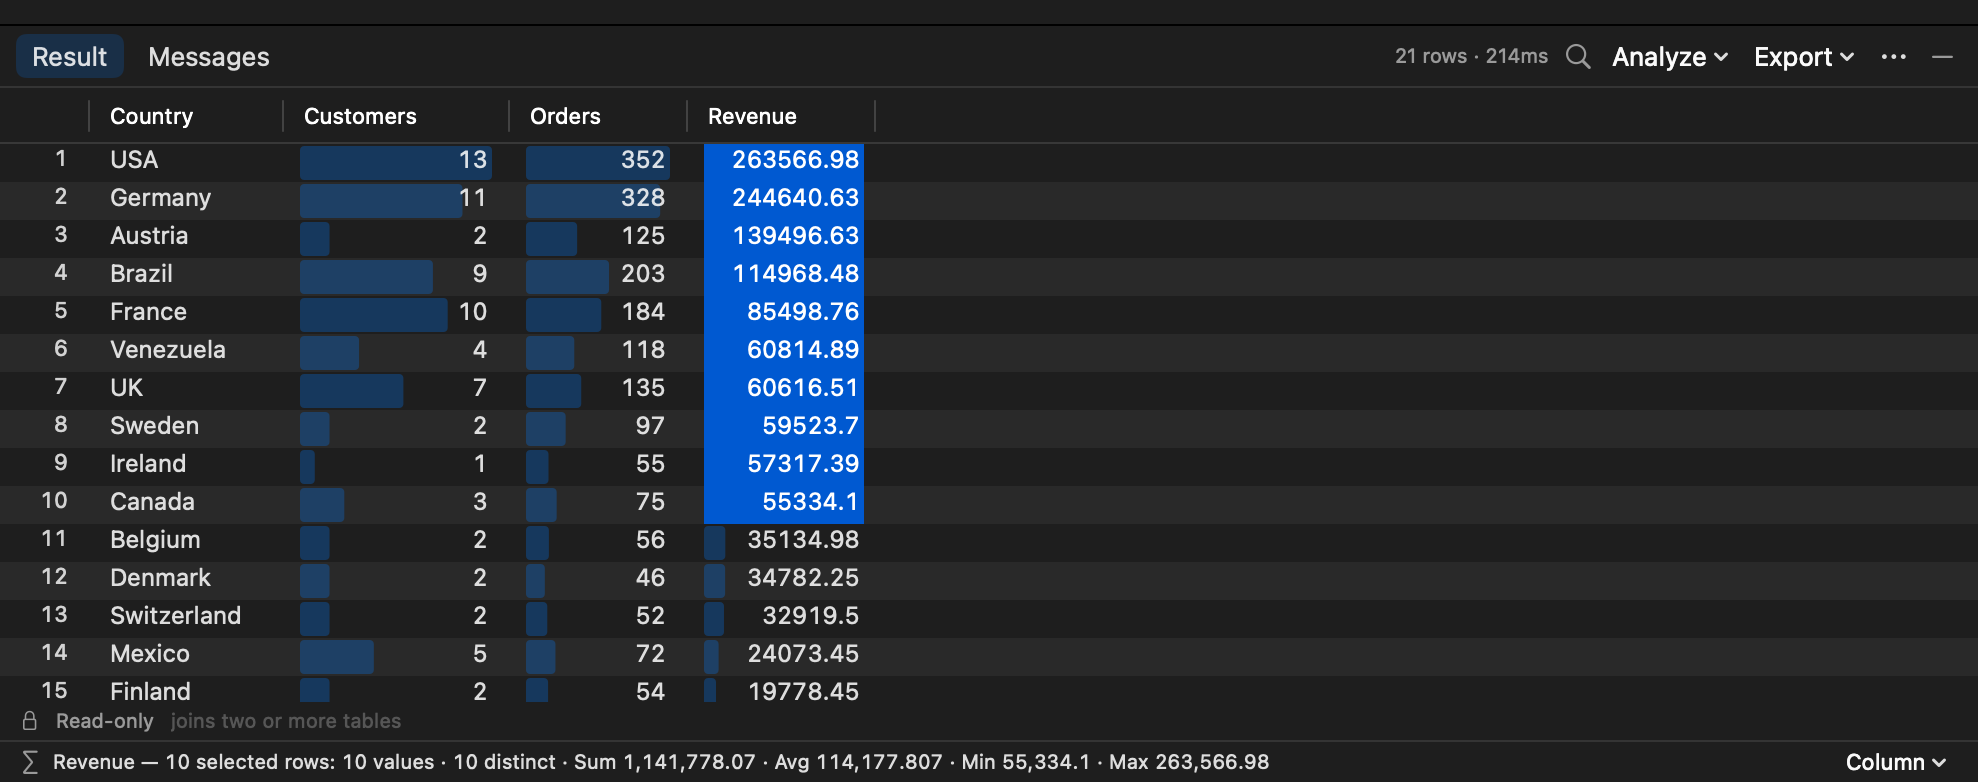
#Data bars
Analyze ▸ Data Bars draws a bar behind each number in proportion to the column's largest value, so the big ones stand out at a glance. The setting is remembered.
#Transpose
Analyze ▸ Transpose turns the selected rows into columns, which is easier to read for a wide row:
| Column | Row 1 |
|---|---|
| ProductID | 1 |
| ProductName | Chai |
| UnitPrice | 18.00 |
| UnitsInStock | 39 |
#Group By
Analyze ▸ Group By ▸ a column counts the rows per value, and sums and averages the number columns: a quick pivot without writing GROUP BY.
Transpose and Group By open as extra, read-only result tabs; on one of them, Analyze ▸ Close This Result removes it.
#The summary of a selection
Select cells and the bar under the grid summarises the active column over the selected rows:
Revenue — 10 selected rows: 10 values · 10 distinct · Sum 1,141,778.07 · Avg 114,177.807 · Min 55,334.1 · Max 263,566.98With nothing selected it covers every row. Column ▾ at its right picks a different column.
#Statistics
Include Statistics in the toolbar (⌥⌘I) adds a Statistics tab with the reads per table and the CPU and elapsed time; see Statistics IO and TIME.